
Behind the scenes: Red Shield Report Q&A
BY KIRRALEE NICOLLE
The Red Shield Report, an annual publication released by The Salvation Army in line with the Red Shield Appeal, this year showed devastating results.
Cost-of-living pressures, food insecurity and housing affordability barriers facing many surveyed families and individuals who accessed The Salvation Army’s Doorways emergency relief services are extreme.
The survey findings showed that 87 per cent of respondents were living below the poverty line, with 92 per cent finding it difficult to afford basic living costs.

Such findings are dire, but they would remain uncalculated without the efforts of The Salvation Army’s award-winning Research Team, part of the Centre for Mission Impact.
The team has been consistently producing a Red Shield Report each year for the past 13 years.
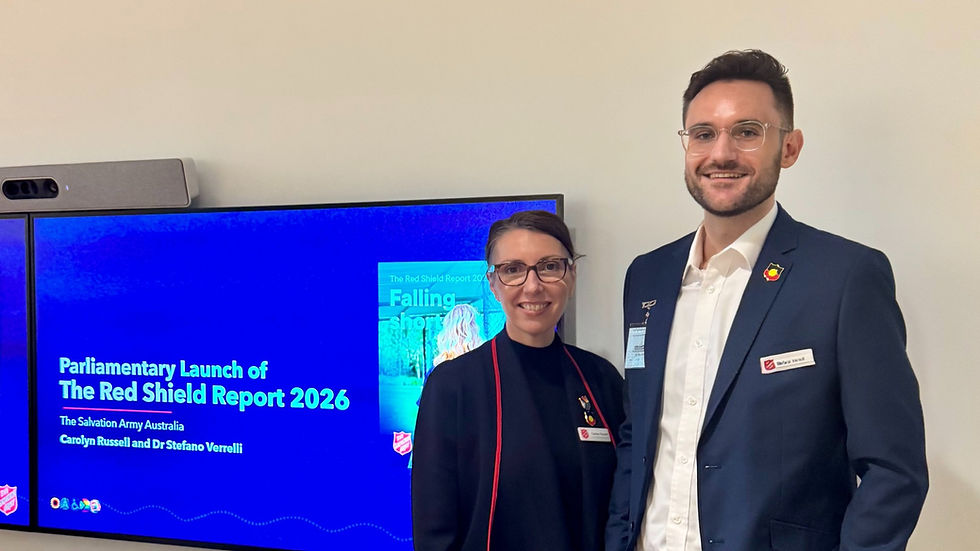
Research Projects Officer Carolyn Russell and Research Analyst Dr Stefano Verrelli were core to the 2026 Red Shield Report survey design. I recently caught up with them to chat about what the experience was like for them.
Salvos Online: Can you tell me a little bit about yourselves and how you found yourselves in these roles?
Carolyn: I started working in government and across the community sector in operational, coordination and project roles, and then I applied to the Salvos. I’ve been working here for just over 12 years now. I started off in social programs and policy before moving into a research and projects role. I suppose I found myself in that space because I wanted to make a difference. I’ve always had a really strong interest in social research and using data and evidence to inform positive and meaningful change for individuals and communities facing disadvantage. I’ve always had a strong social justice approach, so I think it was a really natural progression and evolution.
Stefano: I started with a degree in psychology. I’ve now spent more than 10 years working in social research and spent the last five and a half years working with The Salvation Army’s research team. My initial interest in going into psychology was wanting to help people, particularly people experiencing poor mental health. As I progressed through my studies, I developed a deeper appreciation of social research and how it can help us understand the complexity of the human experience, both the positive and negative sides of it. What drew me to research is how it allows us to move beyond our assumptions to what the evidence is actually telling us, so we can better understand what is actually happening and how we might contribute to positive change. I then completed a PhD in social psychology, where I continued exploring those questions through a social justice lens. As I was doing that research, I realised that I wanted to work closer to the communities experiencing some of these social issues. I valued my academic experience, but I wanted that connection between the research I was doing and people's everyday life to be more direct. That’s what led me into the social services sector, and ultimately, the Salvos. I see my role as building that bridge between people’s lived experiences, frontline practice, the research and evidence side, and high-level decisions that can lead to broader change.

What can you tell me about the process of designing a survey for a report like this?
Stefano: The survey design is quite an iterative process. We have core questions that we ask year in, year out, but each year builds on what we learned in previous years. The design of the survey is also strongly grounded in current affairs – what are the current policy trends and what’s happening in the broader economic environment. With ongoing cost-of-living pressures and the housing crisis, we wanted to understand how that looks for some of Australia’s most vulnerable people and communities. We explore that through a mix of rating scales or closed-ended questions, as well as open-ended questions. We find that the open-ended questions show us the complexity of people’s experiences and what sits behind some of the numbers. They often reveal details or experiences that we may not have anticipated when designing the survey. We can then take that finding and develop it into a question in the following year’s survey to understand how widespread that experience is. For example, one year a number of people shared with us in their open-ended responses that they were losing considerable weight because they couldn’t afford enough food to eat. The following year, we wanted to understand, well, how prevalent is this experience of quite severe food insecurity? So, we created a closed-ended question where people could indicate if this had happened to them in the past 12 months, and we learned that unfortunately it was happening quite frequently amongst people coming to our emergency relief services. This year we found that 40 per cent of survey respondents said they had lost weight because they could not afford enough food. So rather than designing the survey based only on what we think is happening, we draw on what people have shared with us about their lived experiences. Those insights help shape how the survey evolves each year and what we explore in greater depth.
Carolyn: It continues to evolve. It just keeps growing. I think that’s one of the challenges – we don’t want to make it too long and deter people from participating, but we want to be able to cover topics for a broad audience and for broad stakeholders. So that can be a challenge. We want people to complete it, but for it not be too burdensome.
Stefano: And that’s another of the most important considerations when designing the survey and conducting research in the social services sector, making sure that the survey is not only rigorous, but also safe and respectful for the people completing it. We are asking people to share challenging and sometimes sensitive experiences of hardship, so participation is always voluntary, people can skip any question, they can stop at any time. We also pay close attention to the language we use, making sure questions are written in a way that is accessible and non-judgmental. We want to collect evidence that is meaningful and robust, but never at the expense of someone’s wellbeing. Good survey design is always that balance between rigour and care. People are trusting us with their experiences, and we have a deep responsibility to handle that trust with care.
Carolyn: Respondents have shared they’re really glad that they’ve had an opportunity to voice their concerns and experiences, and that somebody’s listening. If they choose not to participate, that’s okay too. That doesn’t impact on the services that they receive.
Stefano: We also try to explore the hardship that people are experiencing, but also balance that with questions about hope, questions about the support they’ve received and what keeps people going. It is important that we don’t reduce people to the difficulties they’re experiencing. We want to understand hardship, but it doesn’t define the whole person, so we try to reflect that complexity as carefully as we can.
We want to collect evidence that is meaningful and robust, but never at the expense of someone’s wellbeing. Good survey design is always that balance between rigour and care.
The findings in the report were quite heartbreaking to read, including increasing food insecurity and cost-of-living impacts on children and families. Can you tell me a bit about what it was like for you personally to handle such data and self-reported hardship?
Stefano: Every year, the scale of the hardship we see is overwhelming. It’s quite enormous. And I think sometimes when you just look at the numbers, it can become quite difficult to comprehend the scale of it. For example, what does 98 per cent of people experiencing something like food insecurity actually mean? But it’s the open-ended responses that never allow you to forget what those numbers represent – the stories that sit behind those really high percentages. And that’s what always grounds me, it is the part that always hits me in the gut. Some of the stories are devastating. But I always have to remain conscious that the emotional impact on me doesn’t even come close to what the experience is like for the person living through that hardship. So, every time I read these stories, I feel this even greater responsibility towards the people who have trusted us with that very personal, often painful part of their experience. Behind every number, behind every story, there is someone who has trusted us with what’s happening in their household, and we have this responsibility to ensure those experiences are represented accurately and with respect, and in a way that can help bring about change.
Carolyn: I think it’s really challenging to hear those repeated experiences of hardship and poverty year in and year out, and you hope that things change over time, but it just doesn’t seem to. This year I felt there was just this really strong sense of despair among respondents. It felt more grave than previous years, like there is this increased level of desperation to make ends meet. It was really confronting that people were starving themselves or going without their critical medication or healthcare because that was seen as not being a priority. People were obviously prioritising housing because it’s critical obviously, but I think it’s just that level of self-deprivation and that constant going without that's quite challenging to read. But also, I feel incredibly humbled and really privileged that we had more than 4400 people who responded and shared those struggles and experiences with us. I felt really honoured and privileged that we could provide them an opportunity and a voice to ensure that their experiences are seen and heard by decision-makers and that such pathways can make a difference for them. That evidence and insight can create change, and we can use it to advocate and support discussions with policymakers to hopefully help people experiencing such chronic disadvantage.
Behind every number, behind every story, there is someone who has trusted us with what's happening in their household, and we have this responsibility to ensure those experiences are represented accurately and with respect, and in a way that can help bring about change.


